Pinpointing Emission Sources from Space
Satellite data combined with wind models bring scientists one step closer to being able to monitor air pollution from space.
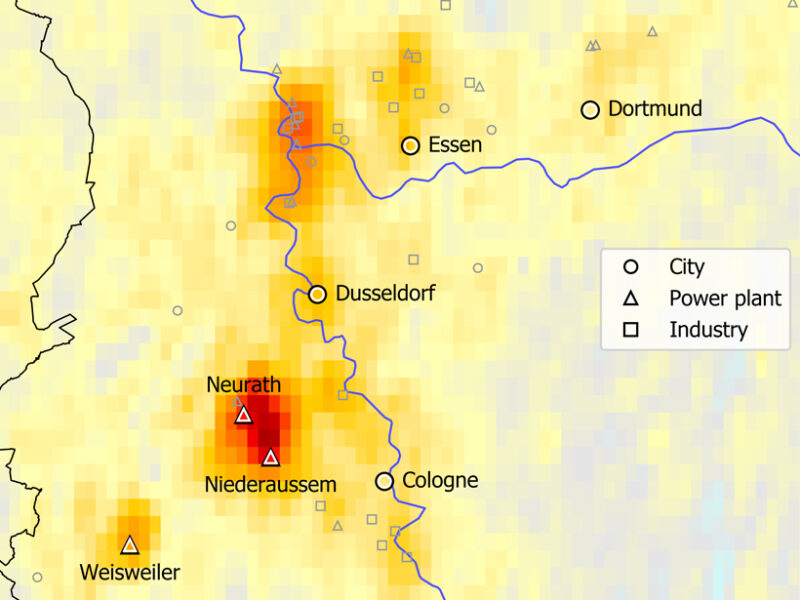
New research combines satellite images with wind models to locate sources of air pollution. This map shows emissions of nitrogen oxides in western Germany, dominated by lignite power plants. Credit: Data from TROPOMI/ESA; created by Steffen Beirle
By Mary Caperton Morton 11 mins ago
Nitrogen oxides are some of the main ingredients in air pollution, smog, acid rain, and greenhouse gas–driven warming. Quantifying large-scale sources of nitrogen oxide pollution has long proved challenging, making regulation difficult, but now a new high-resolution satellite monitoring system, combined with wind modeling, is providing the tools needed to remotely monitor nitrogen oxide emissions anywhere in the world from space.
The Tropospheric Monitoring Instrument (TROPOMI) on board the European Space Agency’s Copernicus Sentinel-5 Precursor satellite, launched in October 2017, offers “unparalleled spatial resolution” of greenhouse gases and pollutants, including nitrogen oxides, carbon dioxide, carbon monoxide, and methane, over industrial complexes and major cities, said Steffen Beirle, a geochemist at the Max Planck Institute for Chemistry in Germany and lead author of the new study published in Science Advances.
But it’s not enough to simply image the gas plumes, as they tend to be smeared horizontally by wind currents. To quantify the amount of gas being emitted, the satellite data must be processed to take wind patterns into account, Beirle said. “If you just look at the map of the satellite measurements, you see polluted spots over the east coast of the U.S. and China, for example. The difficulty comes when you try to quantify the emissions coming from those hot spots.”
The majority of stationary emissions (as opposed to mobile emissions from vehicles) of nitrogen oxides (NO and NO2, commonly combined as NOx) come from power plants. To quantify emissions from individual power plants, Beirle and colleagues combined TROPOMI data with three-dimensional models of wind spatial patterns. “Previous approaches have taken wind data into account, but not in this kind of systematic way,” he said.
More:
https://eos.org/articles/pinpointing-emission-sources-from-space?utm_source=rss&utm_medium=rss&utm_content=pinpointing-emission-sources-from-space